BTC correction or $ 30,000? What's next after the climb?
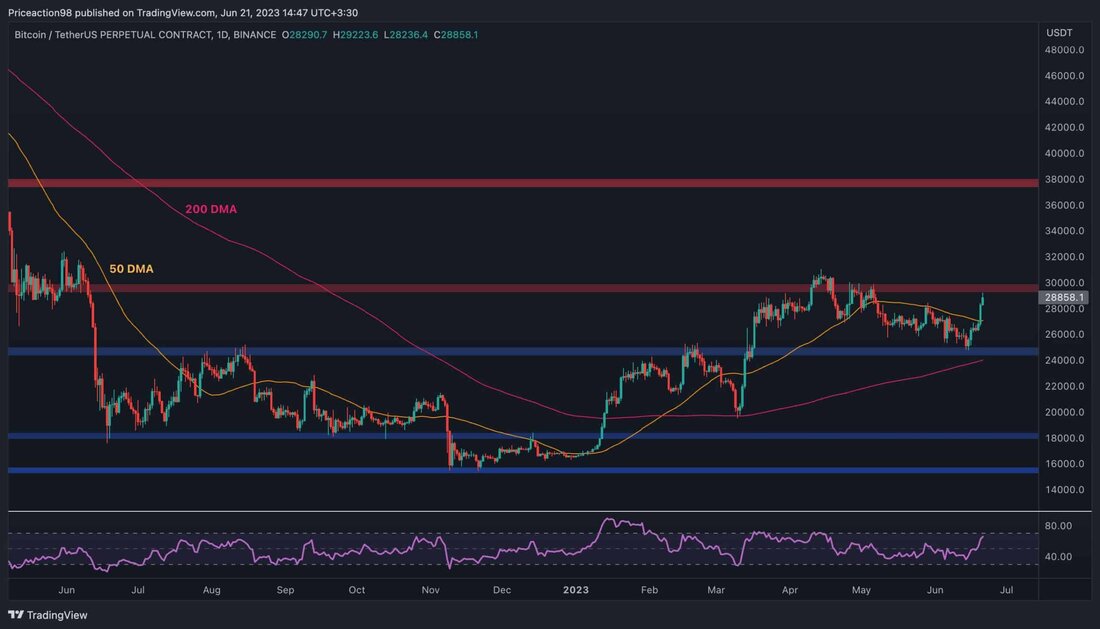
After a gradual correction phase in recent months, the Bitcoin Prize recently experienced a strong increase. However, before sustainable long -term recovery can be expected, the price must overcome a significant level of resistance. Technical analysis of: EDRIS The daily chart: After the Bitcoin price in April had reached the resistance of $ 30,000, it gradually decreased on the daily chart. However, a recent recovery from the level of support of $ 25,000 has led to a continuous rally in the past few days. The price effortlessly exceeded the sliding 50-day average at around $ 27,000 and is now approaching the $ 30,000 mark again. Should it be a ...

BTC correction or $ 30,000? What's next after the climb?
After a gradual correction phase in the past few months, the Bitcoin Prize recently experienced a strong increase. However, before a lasting recovery can be expected, the price must overcome a significant level of resistance.
technical analysis
from: edris
The daily chart:
After the Bitcoin Prize had reached rejection at the resistance level of $ 30,000 in April, it gradually dropped on the daily chart. However, a recent recovery from the level of support of $ 25,000 has led to a continuous rally in the past few days. The price effortlessly exceeded the sliding 50-day average at around $ 27,000 and is now approaching the $ 30,000 mark.
If an interest-bearing outbreak occurs, this could cause optimism for a further upward movement in the medium term, with the next essential resistance area being around $ 38,000.
Tradingview
The 4-hour diagram:
on the 4-hour chart, the price has experienced a quick and steep climb after a V-shaped reversal of the support zone of $ 25,000.
This rally has led to a breakthrough over the considerable descending channel and the $ 27,500 brand, which could now serve as a level of support. However, caution is advised because the RSI indicator points out that the cryptocurrency is overbought. This indicates that a consolidation or correction phase could occur shortly, possibly before a possible outbreak via the important resistance brand of $ 30,000.
Tradingview
on-chain analysis
by: edris
Bitcoin miner reserve
Bitcoin-Miner has recently shown unusual behavior, as on-chain metrics, especially the miner reserve metric, show. It measures the amount of BTC, which is located in the Wallets of the Miner, and there is a noticeable and clear increase, which indicates that a large amount of BTC has been added.
This is remarkable because it follows a phase of the decline in which the miners sold their coins in the middle of the bear market.
The exact reason for this sudden increase in mountain construction reserves is unclear. However, if you keep this newly acquired coins in the long term, this could possibly have a positive effect on the price of Bitcoin.
By keeping their coins instead of selling them immediately, they contribute to reducing direct sales pressure on the market, which leads to a cheaper supply-demand equilibrium and may support an upward movement of the prices.
Tradingview
.

 Suche
Suche
