BTC falls below $ 30,000, but is another crash possible to $ 26,000? (Bitcoin price analysis)
BTC falls below $ 30,000, but is another crash possible to $ 26,000? (Bitcoin price analysis)
The price of Bitcoin has experienced a significant increase in recent months and exceeded several levels of resistance. However, the current trend seems to lose dynamics because cryptocurrency has difficulty claiming the decisive resistance zone of $ 30,000.
technical analysis
of Shayan
the daily -type
The price has broken out of its close consolidation range near $ 28,000 and is now trying aggressively to break the crucial resistance brand at $ 30,000. This level holds both psychological and technical resistance and will probably determine the short -term future of the cryptom market.
If Bitcoin succeeds in exceeding him, this could trigger an upward trend towards the next significant resistance zone of around $ 38,000. However, if it does not break through, a decline in the direction of the sliding 50-day average may come at $ 26,000 or the medium trend line of the canal at around $ 25,000
Despite the result, the bulls can remain hopeful, as long as the price above the sliding 200-day average remains, a crucial indicator of identifying the general tendency of the market.
Tradingview
The 4-hour diagram
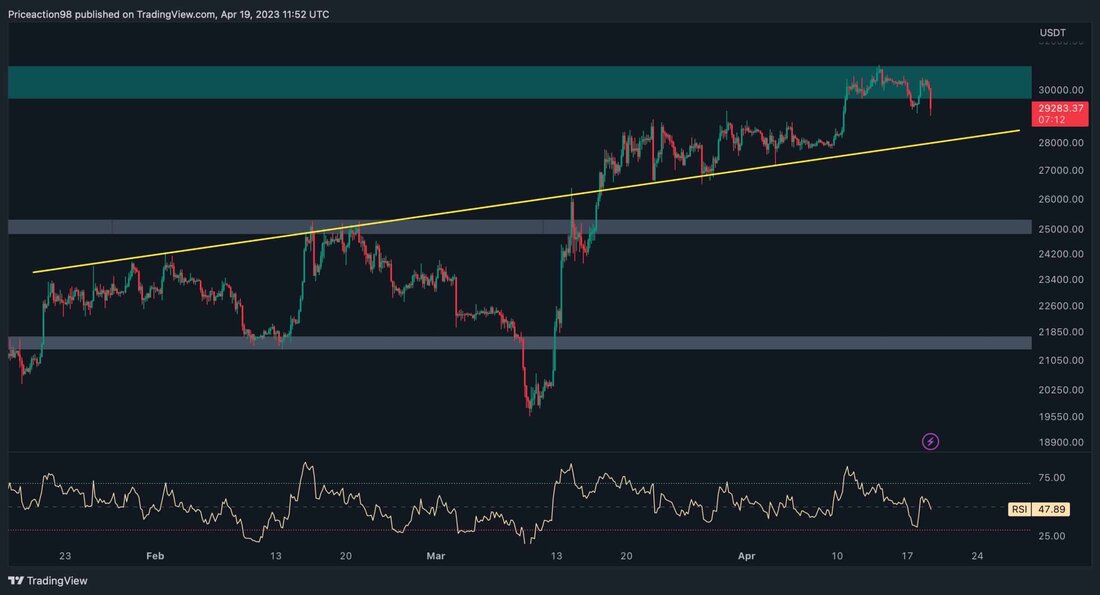
When considering the 4-hour period, it becomes clear that the price of Bitcoin recently formed a head and shoulder pattern, which indicates an increased probability of an impending short-term reversal. However, it is important to note that the trend line that rises several months will take on a more important role as a primary support region if the pattern leads to a rejection.
Despite the development of this pattern, the price of Bitcoin is currently in a state of the suspension that is limited to the dynamic area, which consists between the rising trend line and the critical resistance range of $ 30,000.
Consequently, his medium -term direction remains uncertain and dependent on this range.
Tradingview
on-chain analysis
from Shayan
The metric of the realized price is a crucial instrument to determine whether Bitcoin is overvalued or undervalued. During bullish market cycles, it typically stays above the realized price, while he falls during the bear markets, which causes fear and uncertainty.
The latest movements of Bitcoin are similar to the 2018 bear market. During the last capitulation phase, the price fell significantly below the realized price, which panicked. In the 2019 bull run, however, it returned the realized price level of around $ 4,000 and formed a pullback to test it again.
Recently BTC fell under the realized price, but then started a strong upward trend and exceeded the realized price at $ 20,000. After a short climb, he corrected the level and tested it again, which indicates a healthy upward trend. However, Bitcoin's interest bully outlook remains unchanged, unless it falls below the realized price level.
Cryptoquant
.


Kommentare (0)