Bitcoin forecast for March 31, 2025: Is the BTC course before a relapse to support Fibonacci support at 73,500 USD?
<p> <strong> Bitcoin forecast for March 31, 2025: Is the BTC course before a relapse to support Fibonacci support at 73,500 USD? </strong> </p>
Bitcoin forecast for Monday, March 31, 2025: The course continues to push?
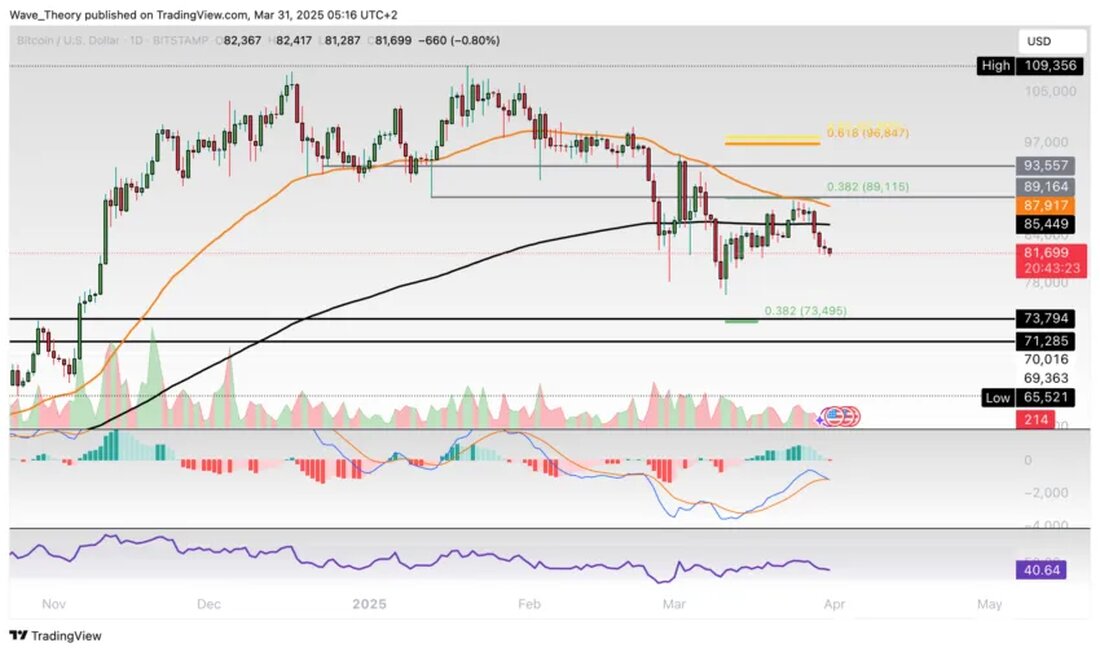
The Bitcoin course has recently received a bear -of -hand rejection and could now fall back on the Fibonacci support at around $ 73,500. The central question is whether Bitcoin will break this support in order to achieve even deeper courses.
Resistance at $ 89,115 not overcome
In the past few days, the Bitcoin course has not been able to overcome the 0.382 FIB resistance at around $ 89,115. The cryptocurrency has been in a downward movement for a week. A return to the Fibonacci support at around $ 73,500 seems possible. There are also between 71,285 USD and 73,800 USD significant levels of support for the BTC course.
The indicators show mixed signals in the daily type. A golden crossover points out that the trend remains bullish short to medium term. However, the MACD lines are about to be crossed a bear, while the histogram of the MacD has been falling well for several days. The RSI behaves neutral.
in the 4H chart dominate Bear Signals
In the 4H chart, the indicators are rather bearish. The EMAs formed a Death Cross a few weeks ago, and the MacD lines show Bärische Crossings. While the RSI is gradually reaching oversold regions and possibly forming a bullish divergence, there is a bear overall for the BTC course. To become Bullish again, Bitcoin has to overcome the Golden Ratio at around 97,000 USD.

long -term downward movement still possible?
In summary, it can be said that Bitcoin was able to bounce off the 50-week MA three weeks ago at around $ 77,700. In the past week, however, the course on the resistance area between $ 89,160 and $ 93,560 was rejected.
The histogram of the MacD continues to show a downward trend, and the MACD lines are crossed. The RSI moves neutral and does not give any clear signals. Despite a golden cross at EMAs, the trend remains bullish in the medium term, as long as Bitcoin holds the Golden Ratio at the $ 50,000 mark. However, if the course breaks the next support between $ 71,285 and $ 73,800, a decline in $ 50,000 could be likely.

Course return to support
In the monkey type, the histogram of the MacD has shown a bearish tendency since last month. Bitcoin is in a correction movement. The MacD lines are crossed bullish, but the RSI does not give any clear signals. If Bitcoin for the Golden Ratio returns support at around $ 50,000, the 50-month AMA offers additional support at around $ 48,162.
Stagnation of the Bitcoin dominance
Bitcoin dominance currently shows stagnation at the Golden Ratio resistance at around 60.5 %. A bullish outbreak could lead to an increase in the next resistance area between 71 % and 74 %. In the case of a bear's rejection, around 54.7 % and 48.5 % are waiting for the next significant fibonacci support. The 50-monthema at around 54.5 % also serves as a level of support.
Nevertheless, the indicators in the monkey type send more bullish signals. The MACD lines have been crossed bullishly and the histogram has been bully higher since the last month. The RSI moves in the neutral area and approaches overbought regions.
FAZIT
The current signals and chart analyzes indicate a potential continuation of the bear's phase for Bitcoin, it remains to be seen whether a return to the golden ratio is $ 50,000, or whether the course could continue down. Investors should observe the support lines and the indicators carefully in order to make trend -friendly decisions.


Kommentare (0)