Bitcoin market on the upswing: whales acumulating BTC and technical indicators indicate possible $ 100,000!
<p> <strong> Bitcoin market on the upswing: whales acumulating BTC and technical indicators indicate possible $ 100,000! </strong> </p>
Bitcoin: Bullisches Signal through whales and technical indicators
Bitcoin, the best-known cryptocurrency, has recently experienced an increase in the confidence of the so-called "whales"-large Bitcoin holder. These whales start to accumulate BTC again, which is interpreted as a bullish signal for the market. Technical indicators such as the Ichimoku cloud and the exponential sliding average (EMA) support the positive mood.
Bitcoin whale stocks at the highest level since December 15th
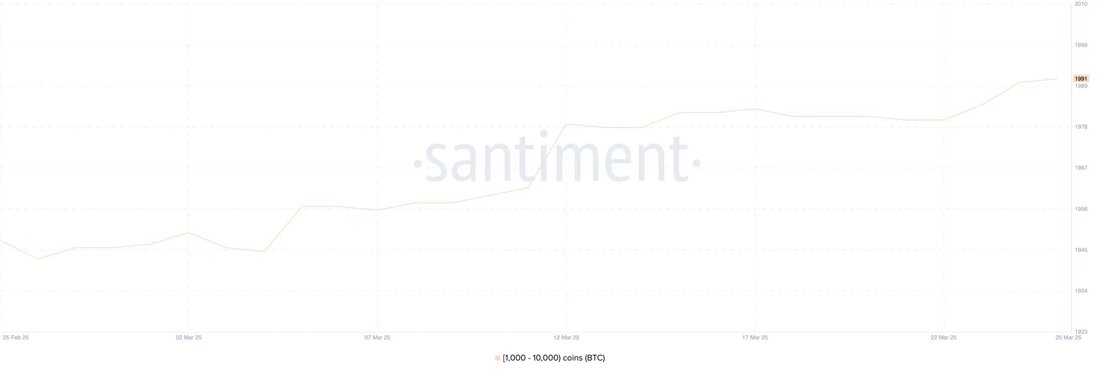
The number of Bitcoin wallets that hold between 1,000 and 10,000 BTC rose from 1,980 on March 22nd to 1,991 on March 25th. This has been the highest level since December 15th. Although this increase is relatively modest, it nevertheless reflects a new accumulation by large owners, after more than three months of calm activity.
The monitoring of the Wal portfolios is of great importance, since these important actors often affect the markets. Your patterns of accumulation or distribution can act as early warning signals for more comprehensive mood changes or larger price movements. Whales are often considered "smart money"; Your increasing interest can therefore be an indicator of increased trust in short -term market development.
Bitcoin ichimoku-cloud shows good momentum
The Ichimoku cloud chart from Bitcoin has a bullish structure. The price movements are well above the cloud, which is currently green and increases. The Tenkan-Sen (blue) is positioned above the Kijun-Sen (red), which indicates a continued short-term upward dynamics. However, both lines show signs of flattening, which could indicate a possible consolidation.
The future cloud (Kumo) is wide and increases, which indicates a solid supportive basis and growing trend strength. The Chikou Span, the recording line, is well positioned over the past course movement and also confirms the bullish mood. In the short term, sideways movements could occur, but the entire Ichimoku setup remains bullish as long as there is no breakthrough under the clouds.
will the Bitcoin course rise again in April on the 100,000 USD brand?
The Bitcoin EMA lines seem to be aligned with a potential golden cross, which could signal the beginning of a new bullish phase. If this crossover occurs and the Bitcoin course broke the resistance at $ 88,807, this could lead to a movement in the direction of 92,928 USD.
A strong continuation of the upward trend could help Bitcoin to test the brands of $ 96,503 and $ 99,472, with the possibility of outbreak over $ 100,000, provided that the momentum increases.
However, Bitcoin should not increase over $ 88,807 and experience a trend reversal, the course could fall back and test the support at $ 84,736. A breakthrough under this level could lead to further downward movements towards $ 81,162. If the sales pressure continued, Bitcoin could even reach $ 79,970 and $ 76,644 and possibly fall below the 80,000 USD mark.Overall, the current developments around Bitcoin offer both opportunities and risks. Investors should therefore carefully observe the market movements and technical indicators.


Kommentare (0)