Bitcoin loses $ 23,000, but is there another increase? (BTC price analysis)
Bitcoin loses $ 23,000, but is there another increase? (BTC price analysis)
The market was struggling to rise over the significant resistance brand of $ 25,000, and now the price is slowly falling. Therefore, the possibility of correction has increased before the next rally.
technical analysis
from Shayan
the daily -type
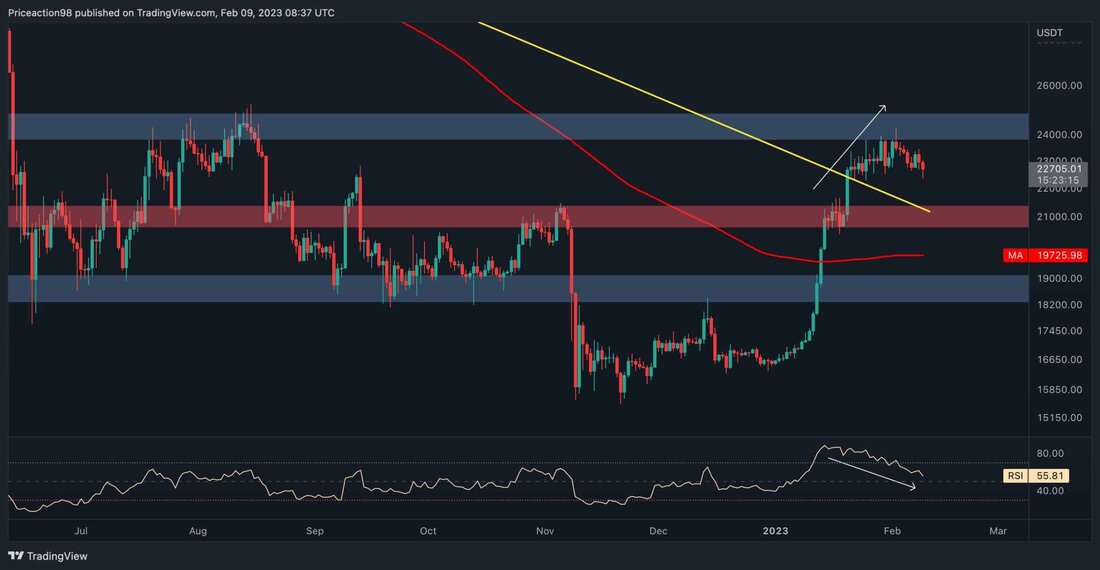
The region of $ 24,000 to 25,000 currently offers Bitcoin the greatest resistance in the daily time frame. It is also an important psychological level because it has been the main barrier in the past eight months.
Due to the most recent house-phase of the market, the price has increased and has reached the $ 24,000 region. However, the bulls did not manage to drive the price about it and it was rejected. In addition, a persistent declining divergence between the price and the RSI indicator increases the likelihood of short-term correction.
Nevertheless, the cryptocurrency could test the sliding 200-day average and the broken trend line again before initiating another rally with the aim of $ 25,000
Tradingview
The 4-hour diagram
In the 4-hour period, the price fell below the lower border of the flag and tested the trend line again to complete the pullback, which signaled confirmation of the pattern described. However, the positive momentum was weaker than expected, which led to fluctuations in BTC.
In the meantime, a static level of support has formed at the level of $ 22.3,000. As a result, many sales stop orders below this level of support offer sufficient liquidity that the market can take before it initiates the next movement.
Therefore, the short-term consolidation correction scenario is approved for the time being, unless the bulls surprise the market and print a large green candle on the BTC charts.
Tradingview
on-chain analysis
of Shayan
The Puell Multiple metrics offer the participants a broader insight into the market phase by asking: "How profitable are mining pools compared to last year if all of the bitcoins created are immediately distributed on the market?"
Historically, the market found a floor every time the metric fell into the green area and marked the last phase of the bear phase. Accordingly, the metric had fallen into the green area due to the massive downward trend from Bitcoin in recent months. However, the latest upward trend of the Bitcoin Prize has led to an increase and leaving the green zone.This could be interpreted as an interest bully sign that indicates that the bear market is over and Bitcoin may have found its low point. Nevertheless, there is always a reverse scenario on the table, and the latest price increase could be another important bull trap. Therefore it is better to be careful.
Cryptoquant
.


Kommentare (0)