ADA crashes by 7 % weekly, as deep as it could fall (ADA price analysis)
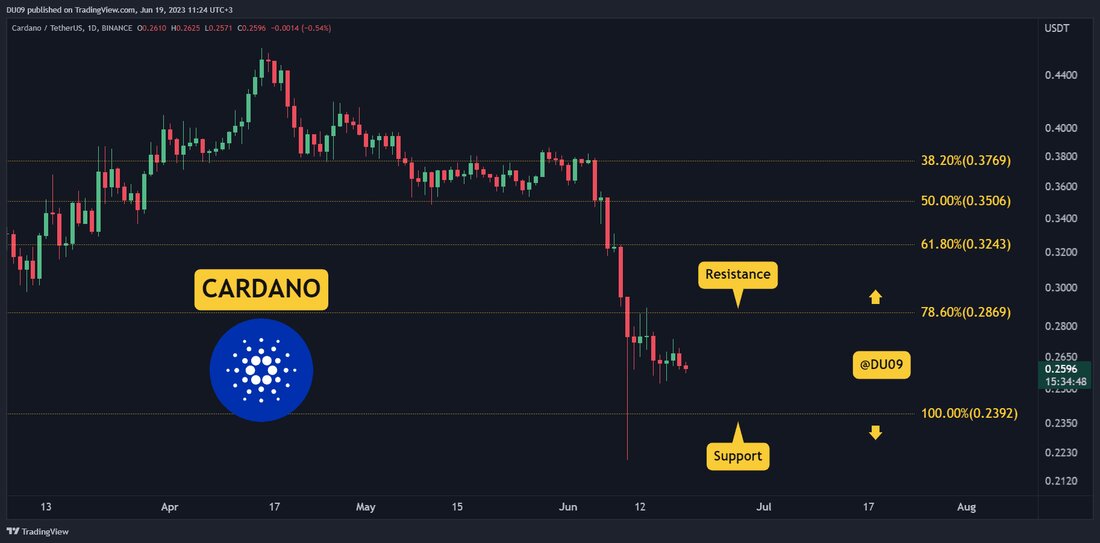
Since the volatility decreases, buyers could soon have the opportunity to stop the downward trend. Important support levels: $ 0.24 Important resistance level: $ 0.29 The weekly price for ADA has a loss of 7 %. However, since the crash on June 10, the sellers seem to have lost interest and have not managed to reduce the price. With good support at 24 cents, bulls could have a chance in the coming days to drive ADA up. Diagram of TradingView Commercial volume: The volume has broken down in the past few days. It seems that the sellers are not currently in force ...

ADA crashes by 7 % weekly, as deep as it could fall (ADA price analysis)
Since the volatility decreases, buyers could soon have the opportunity to stop the downward trend.
Important support levels: 0.24 $
Important resistance level: $ 0.29
The weekly price for ADA has a loss of 7 %. However, since the crash on June 10, the sellers seem to have lost interest and have not managed to reduce the price. With good support at 24 cents, bulls could have a chance in the coming days to drive ADA up.
Diagram of Tradingview
trading volume: The volume has broken down in the past few days. It seems that the sellers currently do not have the power to continue the downward trend. This offers the possibility of reversal.
rsi : The daily RSI has been in the oversold area of less than 30 points since June 9th. This is bearish, but could also mean that ADA could soon leave this area to try an outbreak.
macd : The daily MacD is bearish, but the histogram has higher deep stalls. If this goes on like this, a trend reversal appears.
Diagram of Tradingview
bias
The tendency for Ada is bearish.
Short-term forecast for the ADA Prize
Ada urgently needs a recreation rally that was delayed after the severe decline last week. This exhaustion of the seller could soon be an opportunity for bulls to drive the price to the important resistance at 29 cents.
.

 Suche
Suche
 Mein Konto
